Monitoring
Enable the internal monitoring
In this the example the used namespace is ibexa-test, but it needs to be set
to the current namespace the chart is running in.
---
global:
  auth:
    adminPassword: verystrongpassword

monitoring:
  enabled: true
  prometheus:
    kube-state-metrics:
      namespaces: "ibexa-test"
mysql:
  metrics:
    enabled: true
solr:
  metrics:
    enabled: true
Monitoring GUI for Ibexa
The monitoring GUI is available under https://example.com/grafana (replace example.com
with the first value from global.routes.frontends). The initial username is admin
and initial password is the one you set from global.auth.adminPassword.
The monitoring GUI includes the following apps and dashboards:
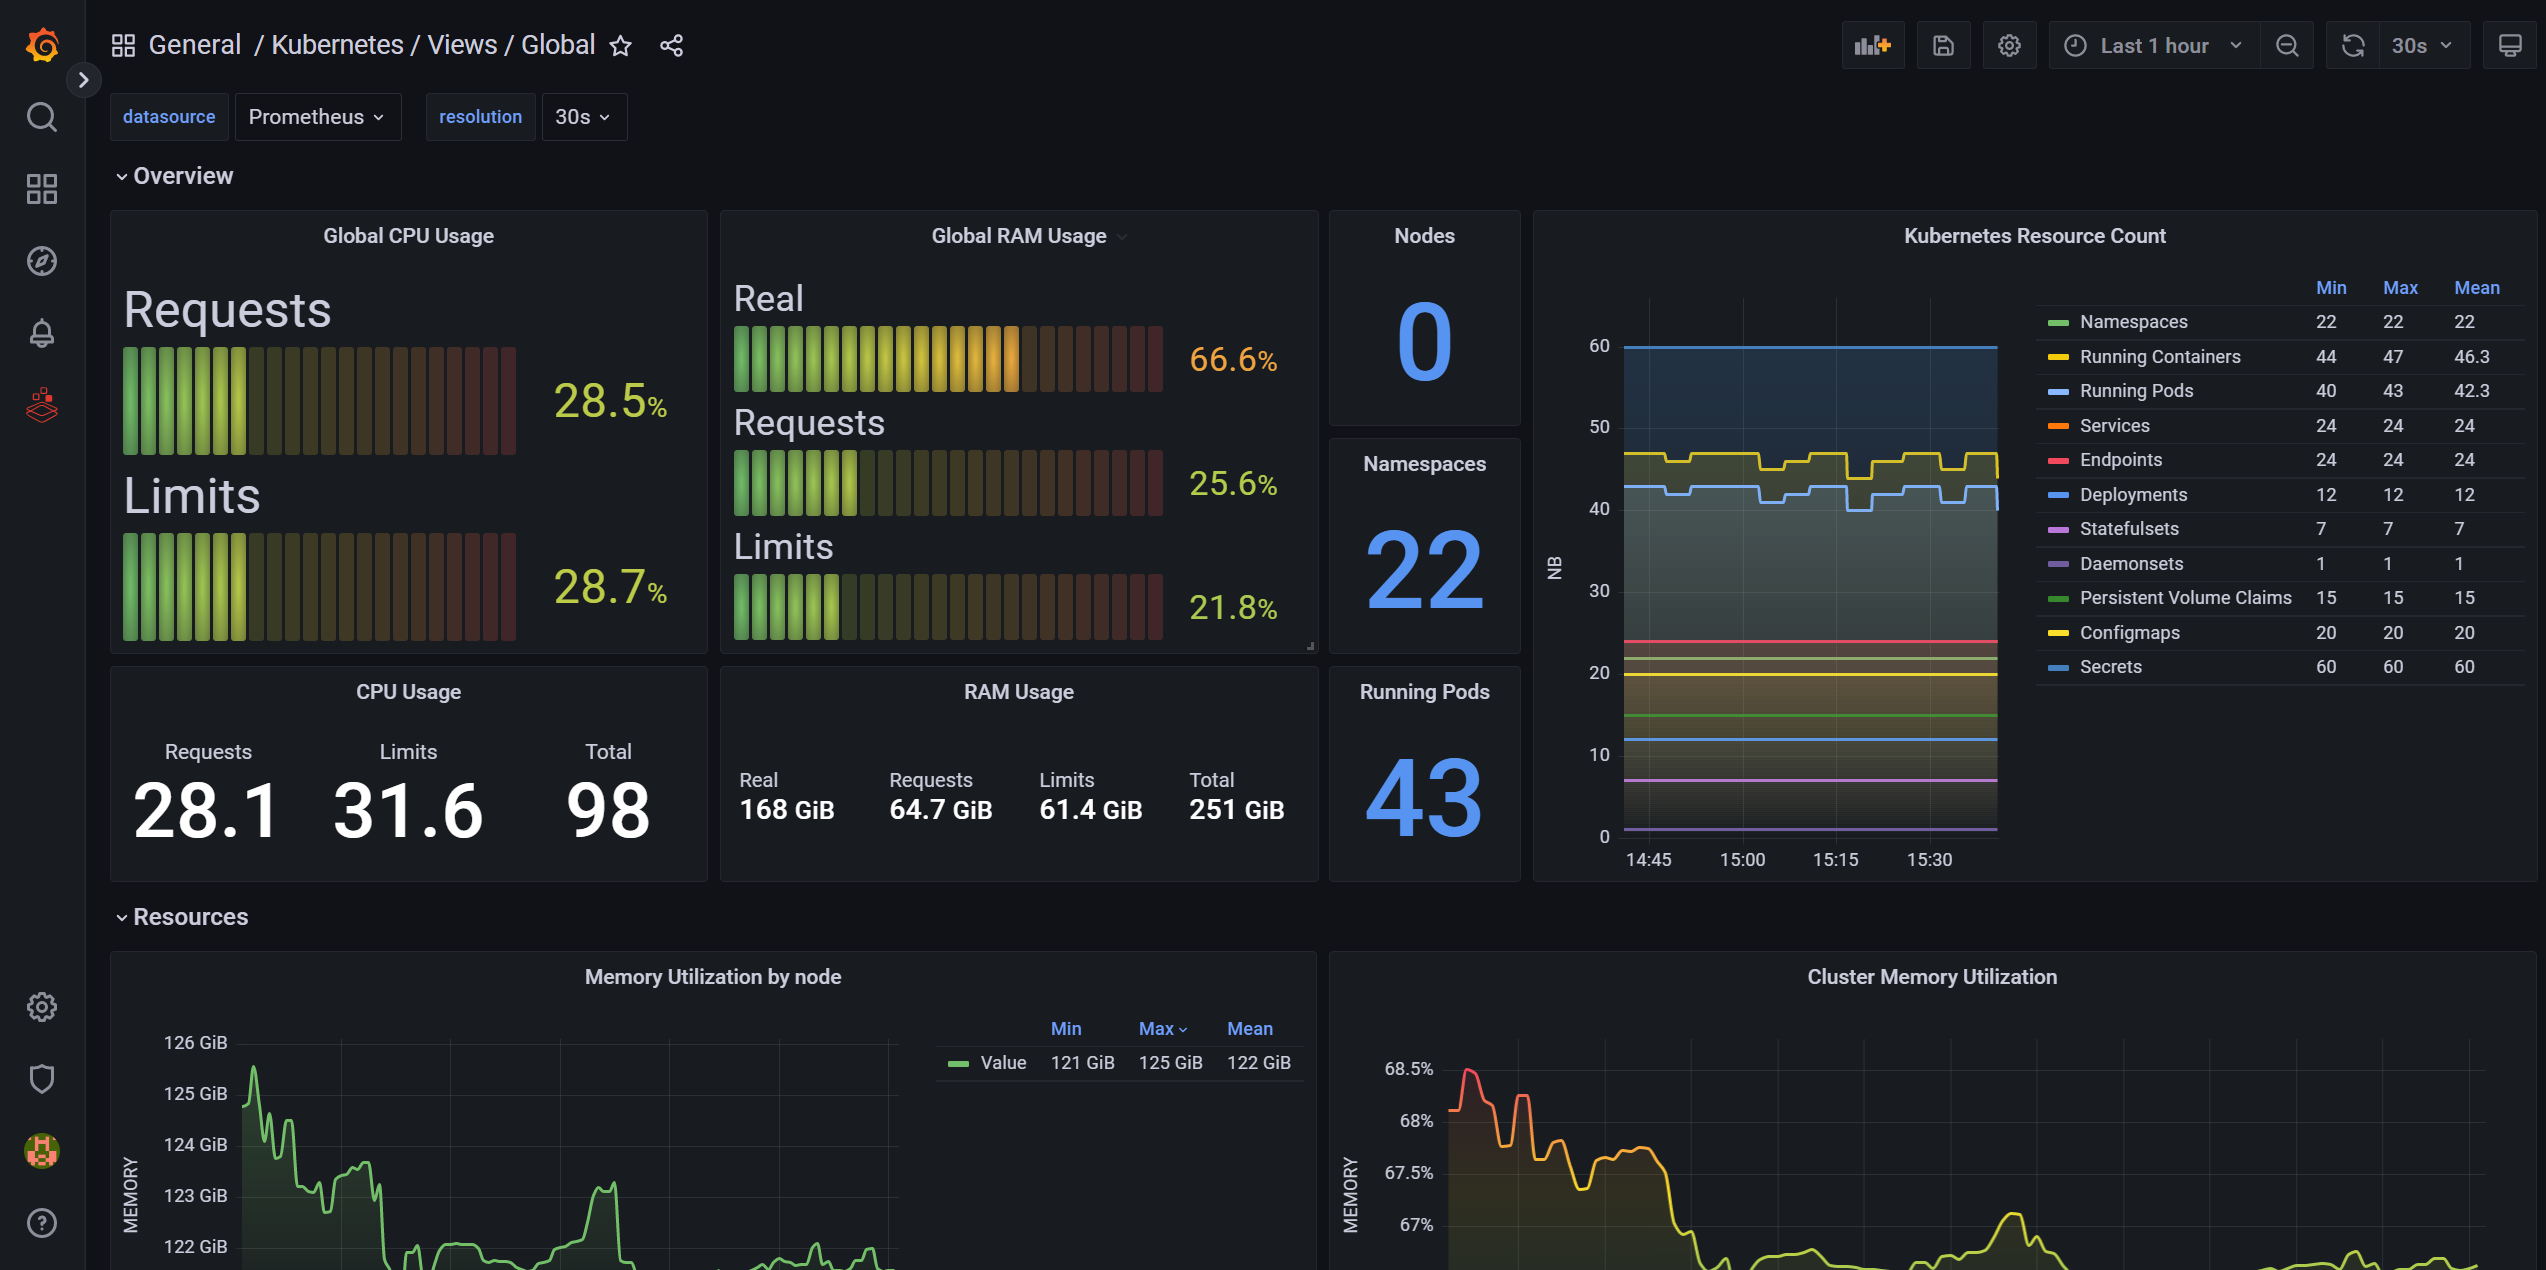
- Kubernetes Global View (Dashboard)
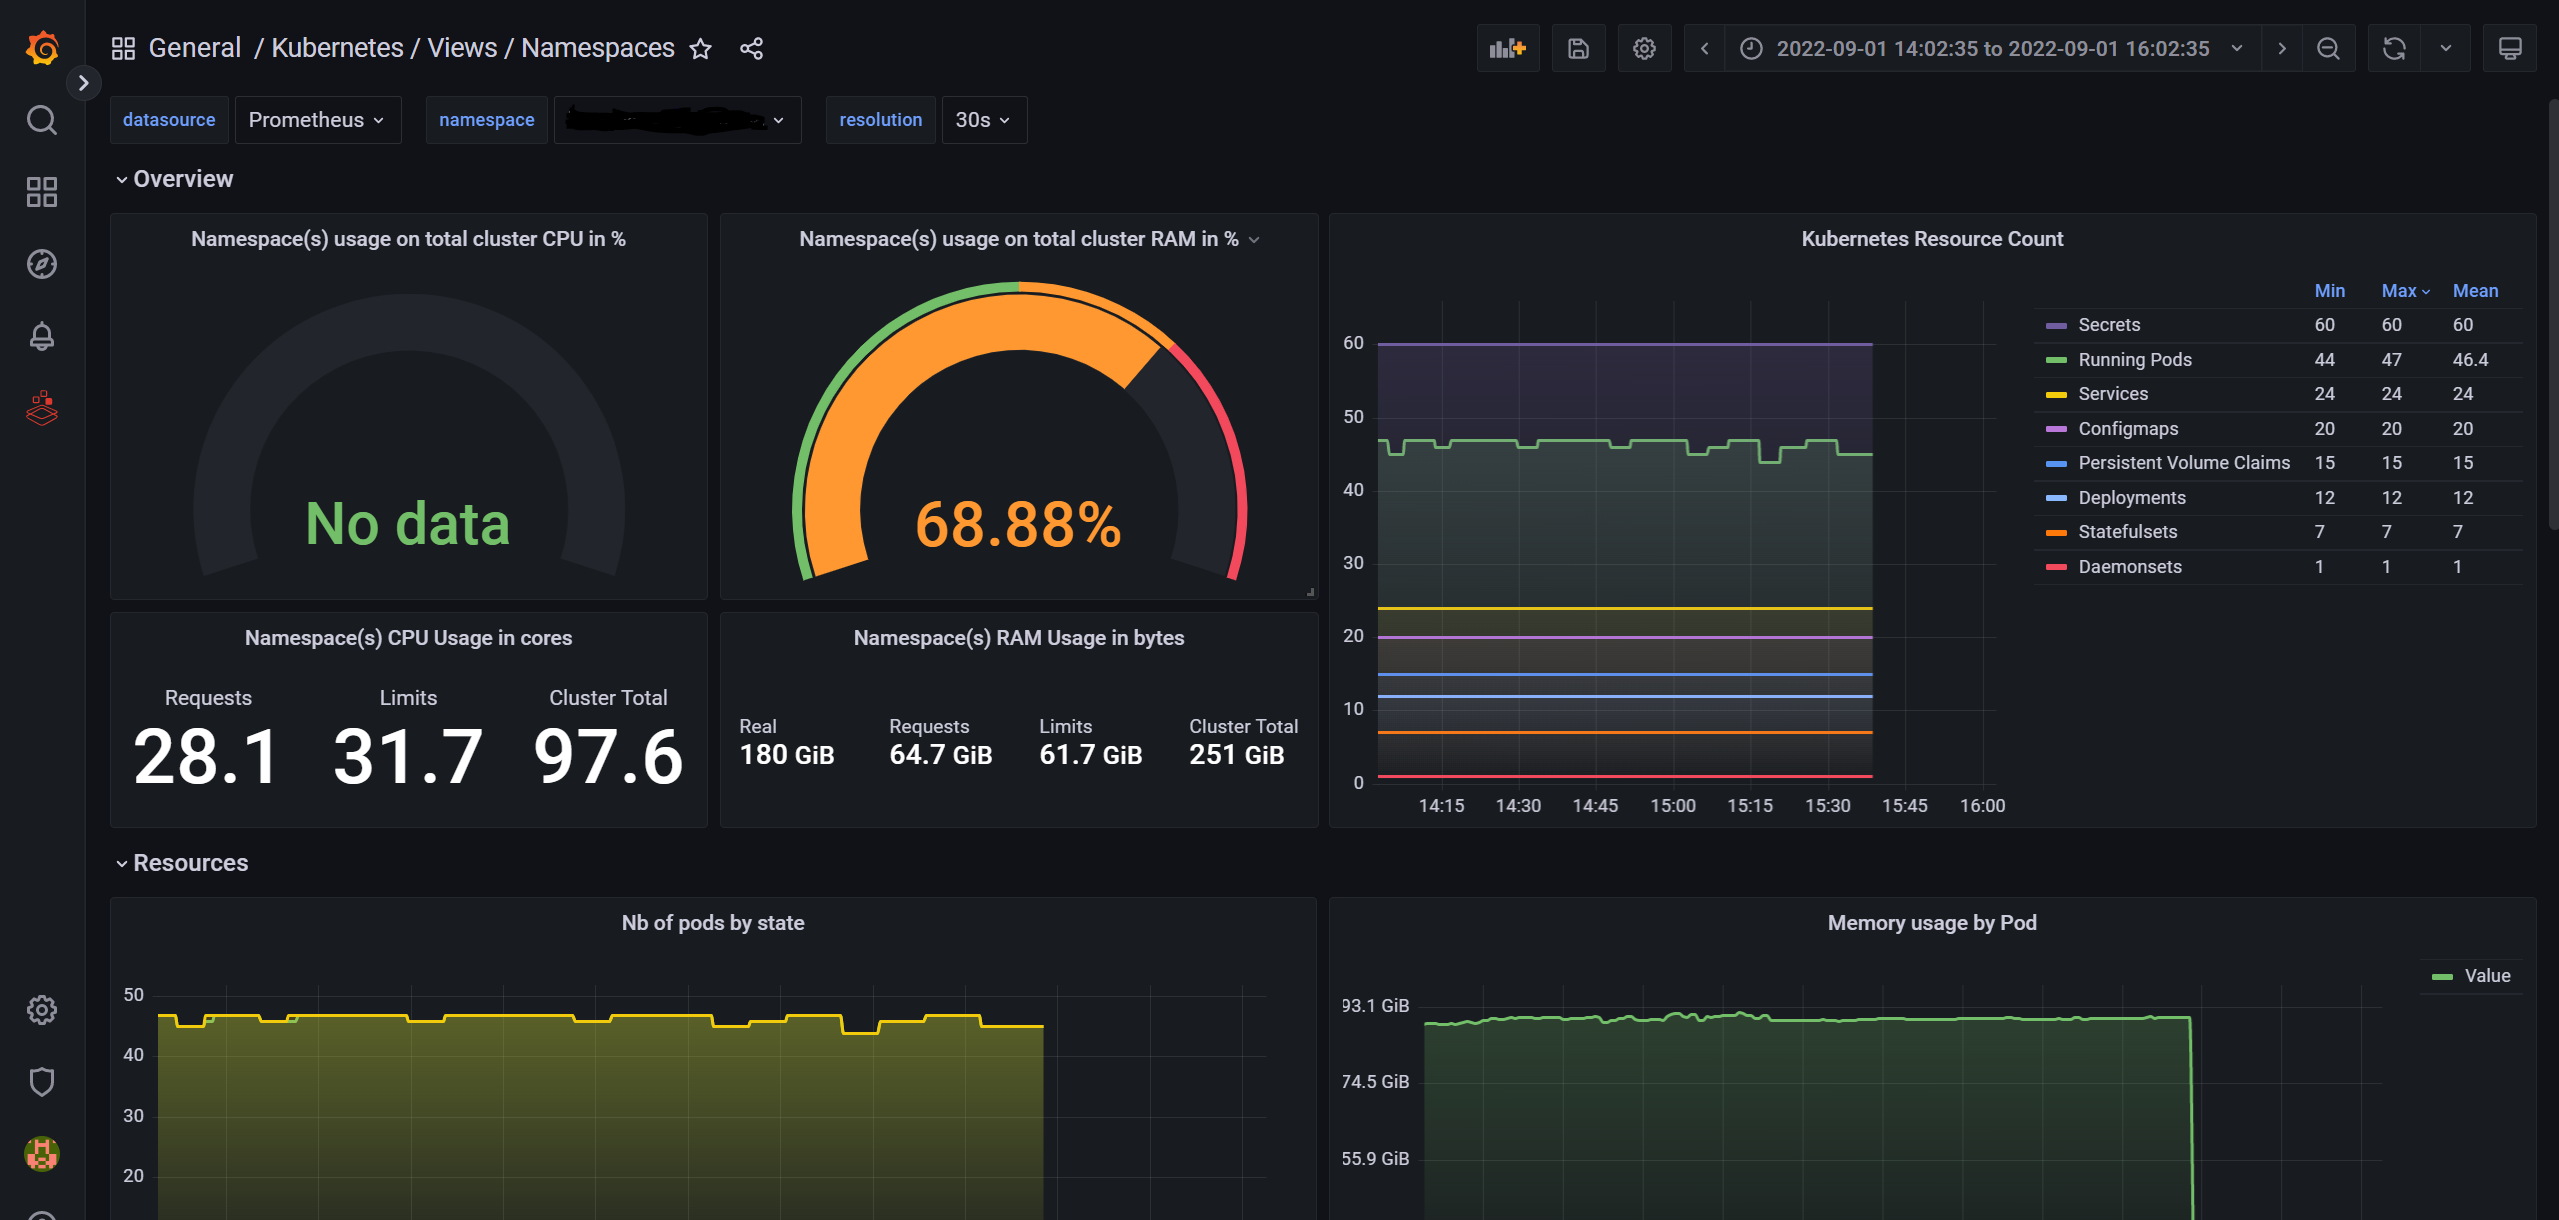
- Kubernetes Namespace View (Dashboard)
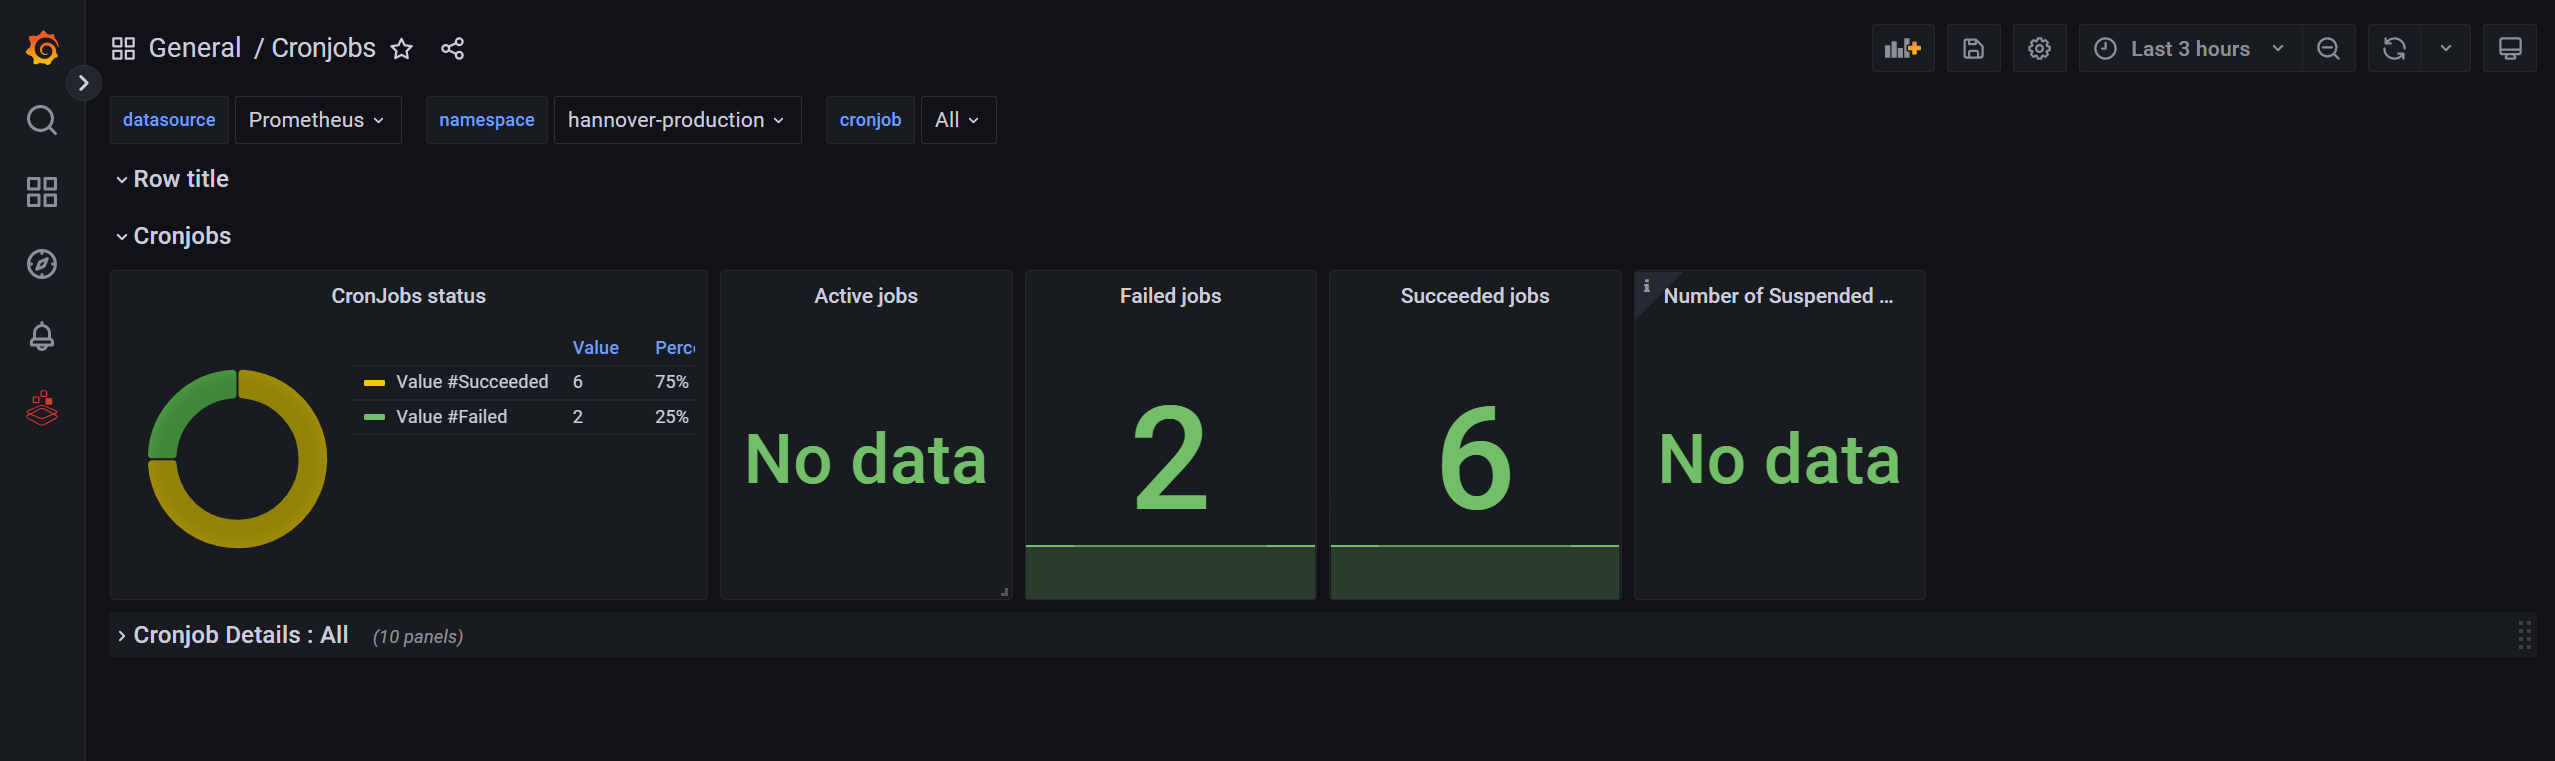
- Cronjobs (Dashboard)
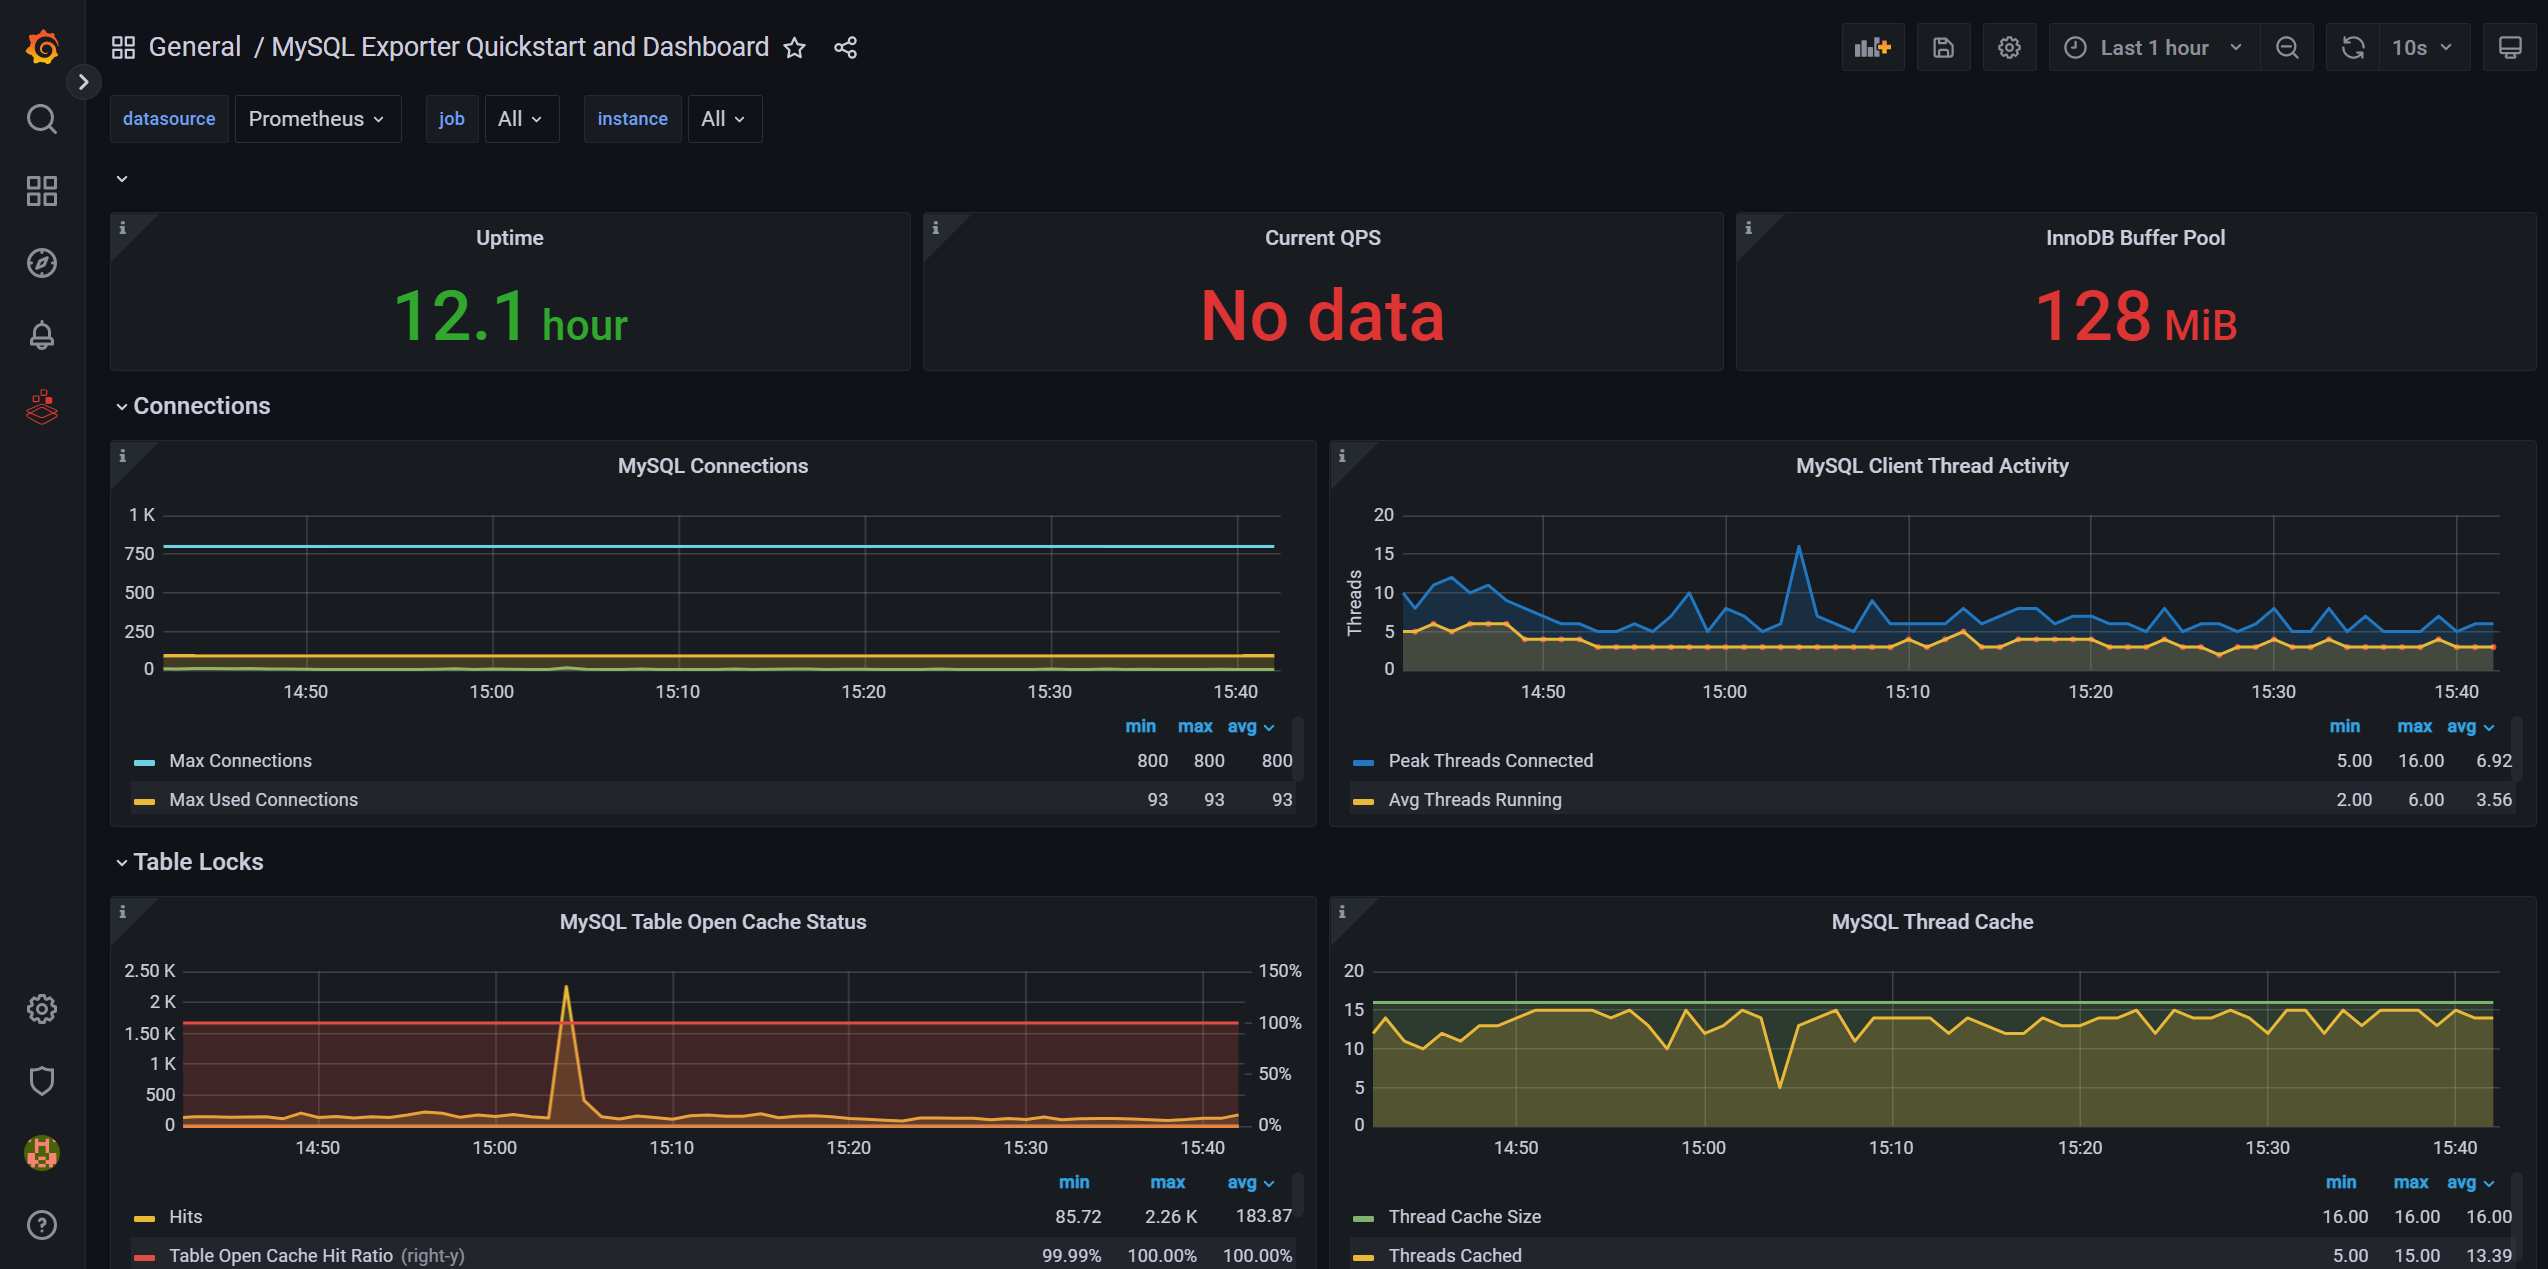
- MySQL (Dashboard)
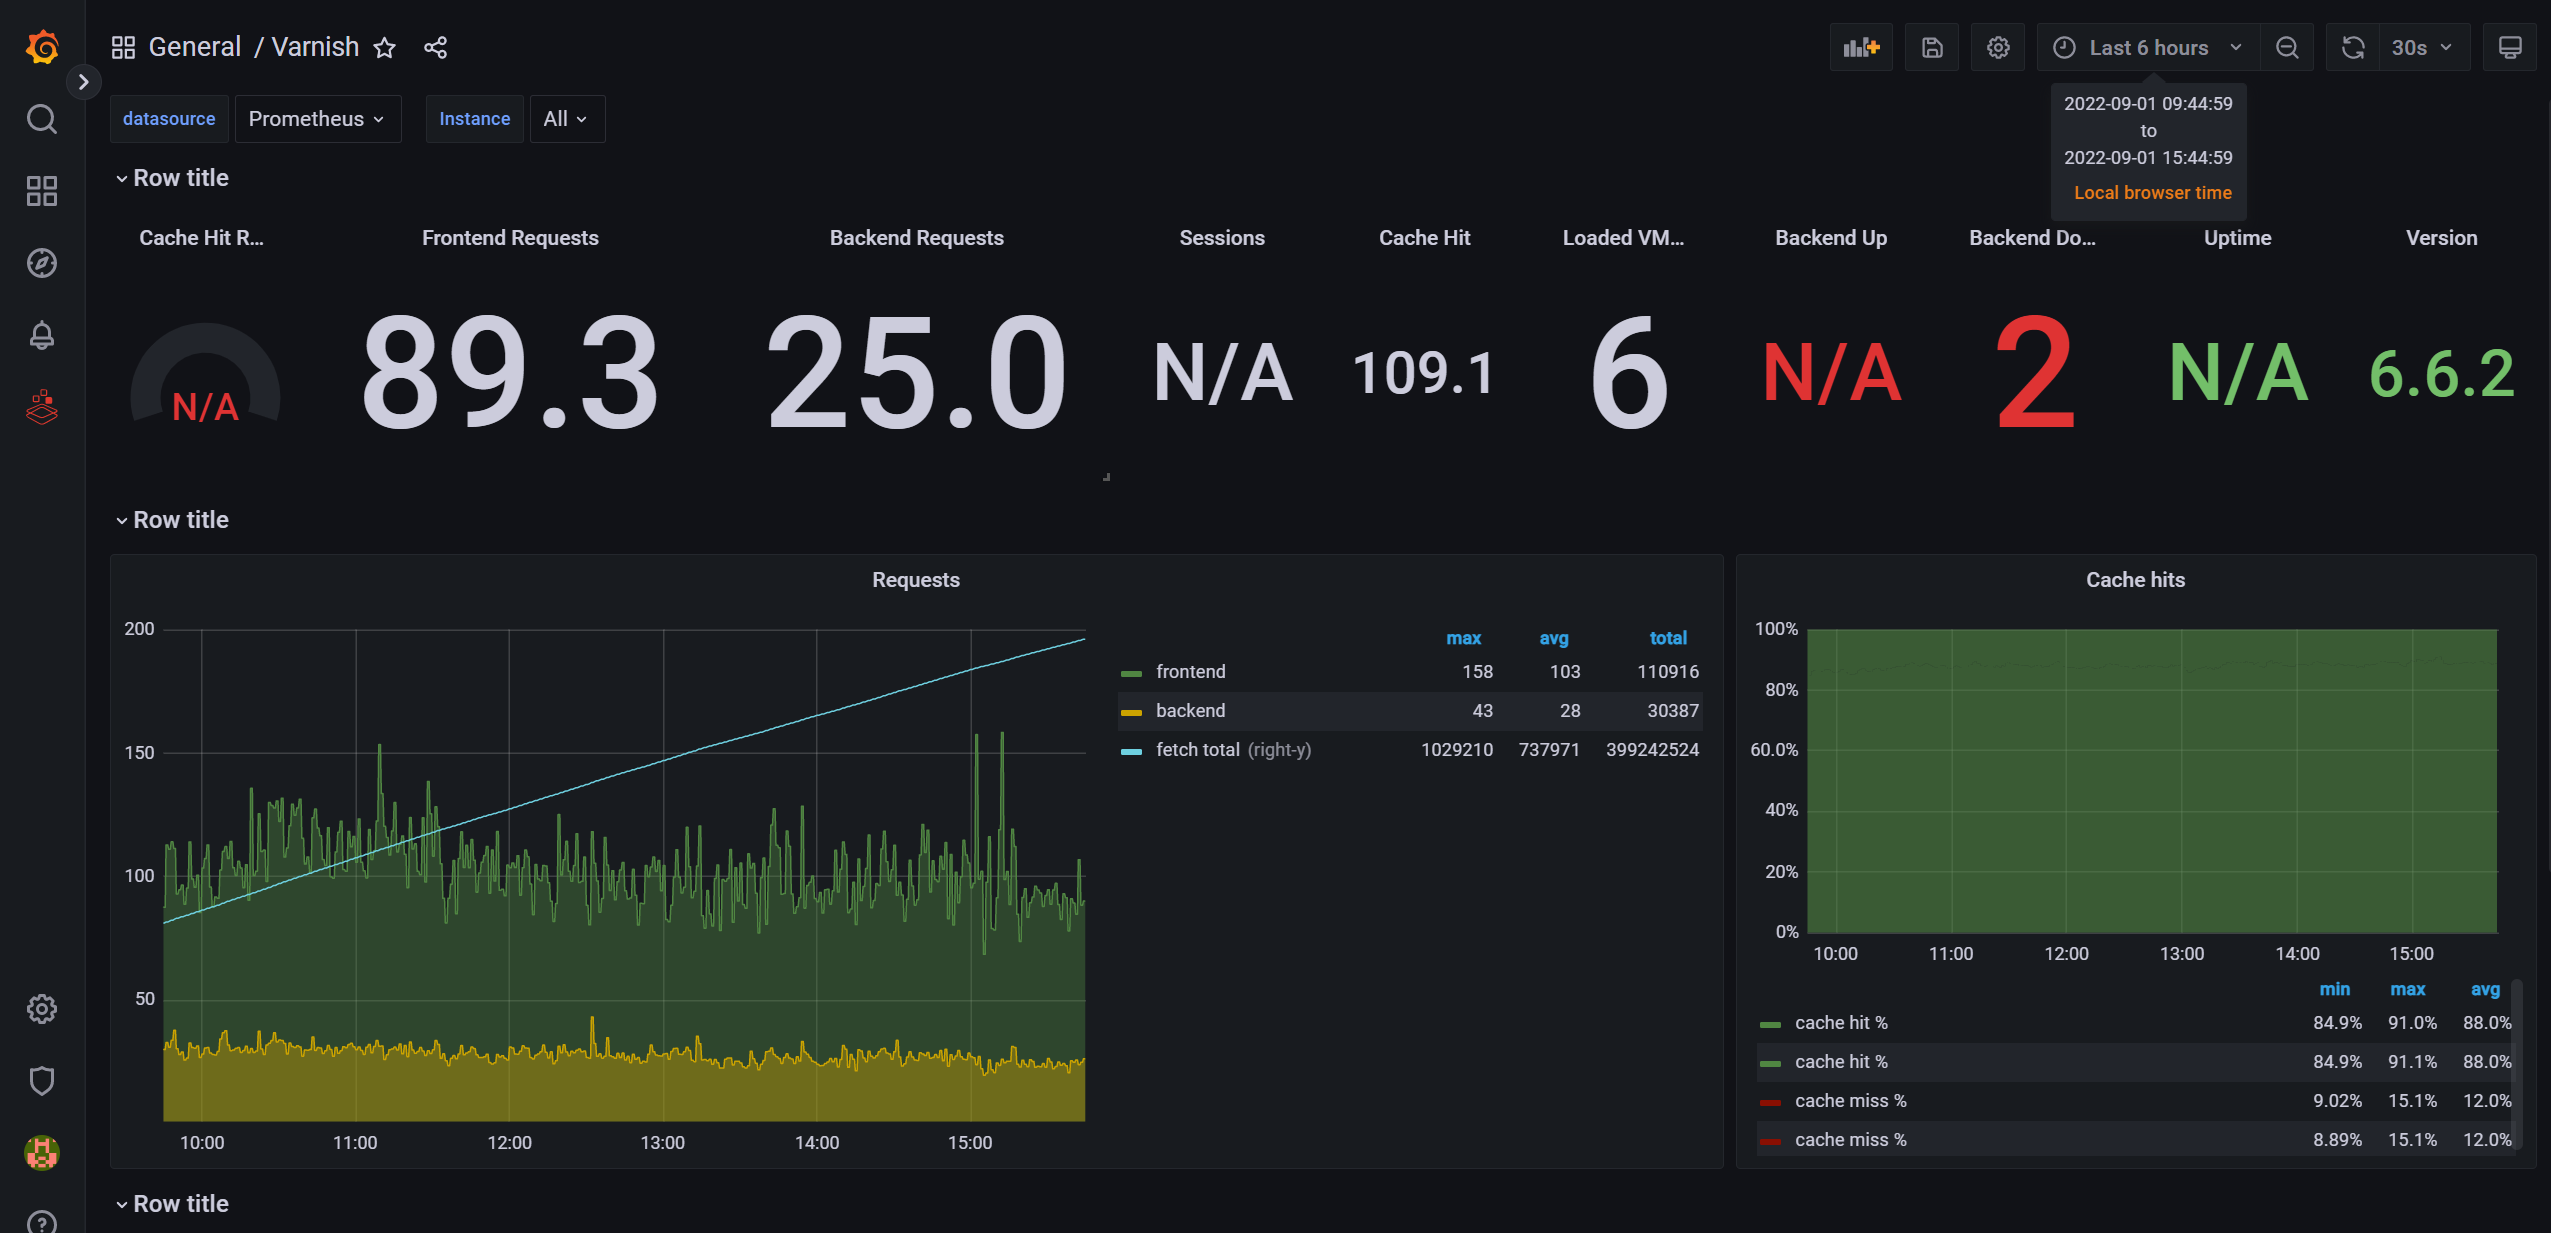
- Varnish (Dashboard)
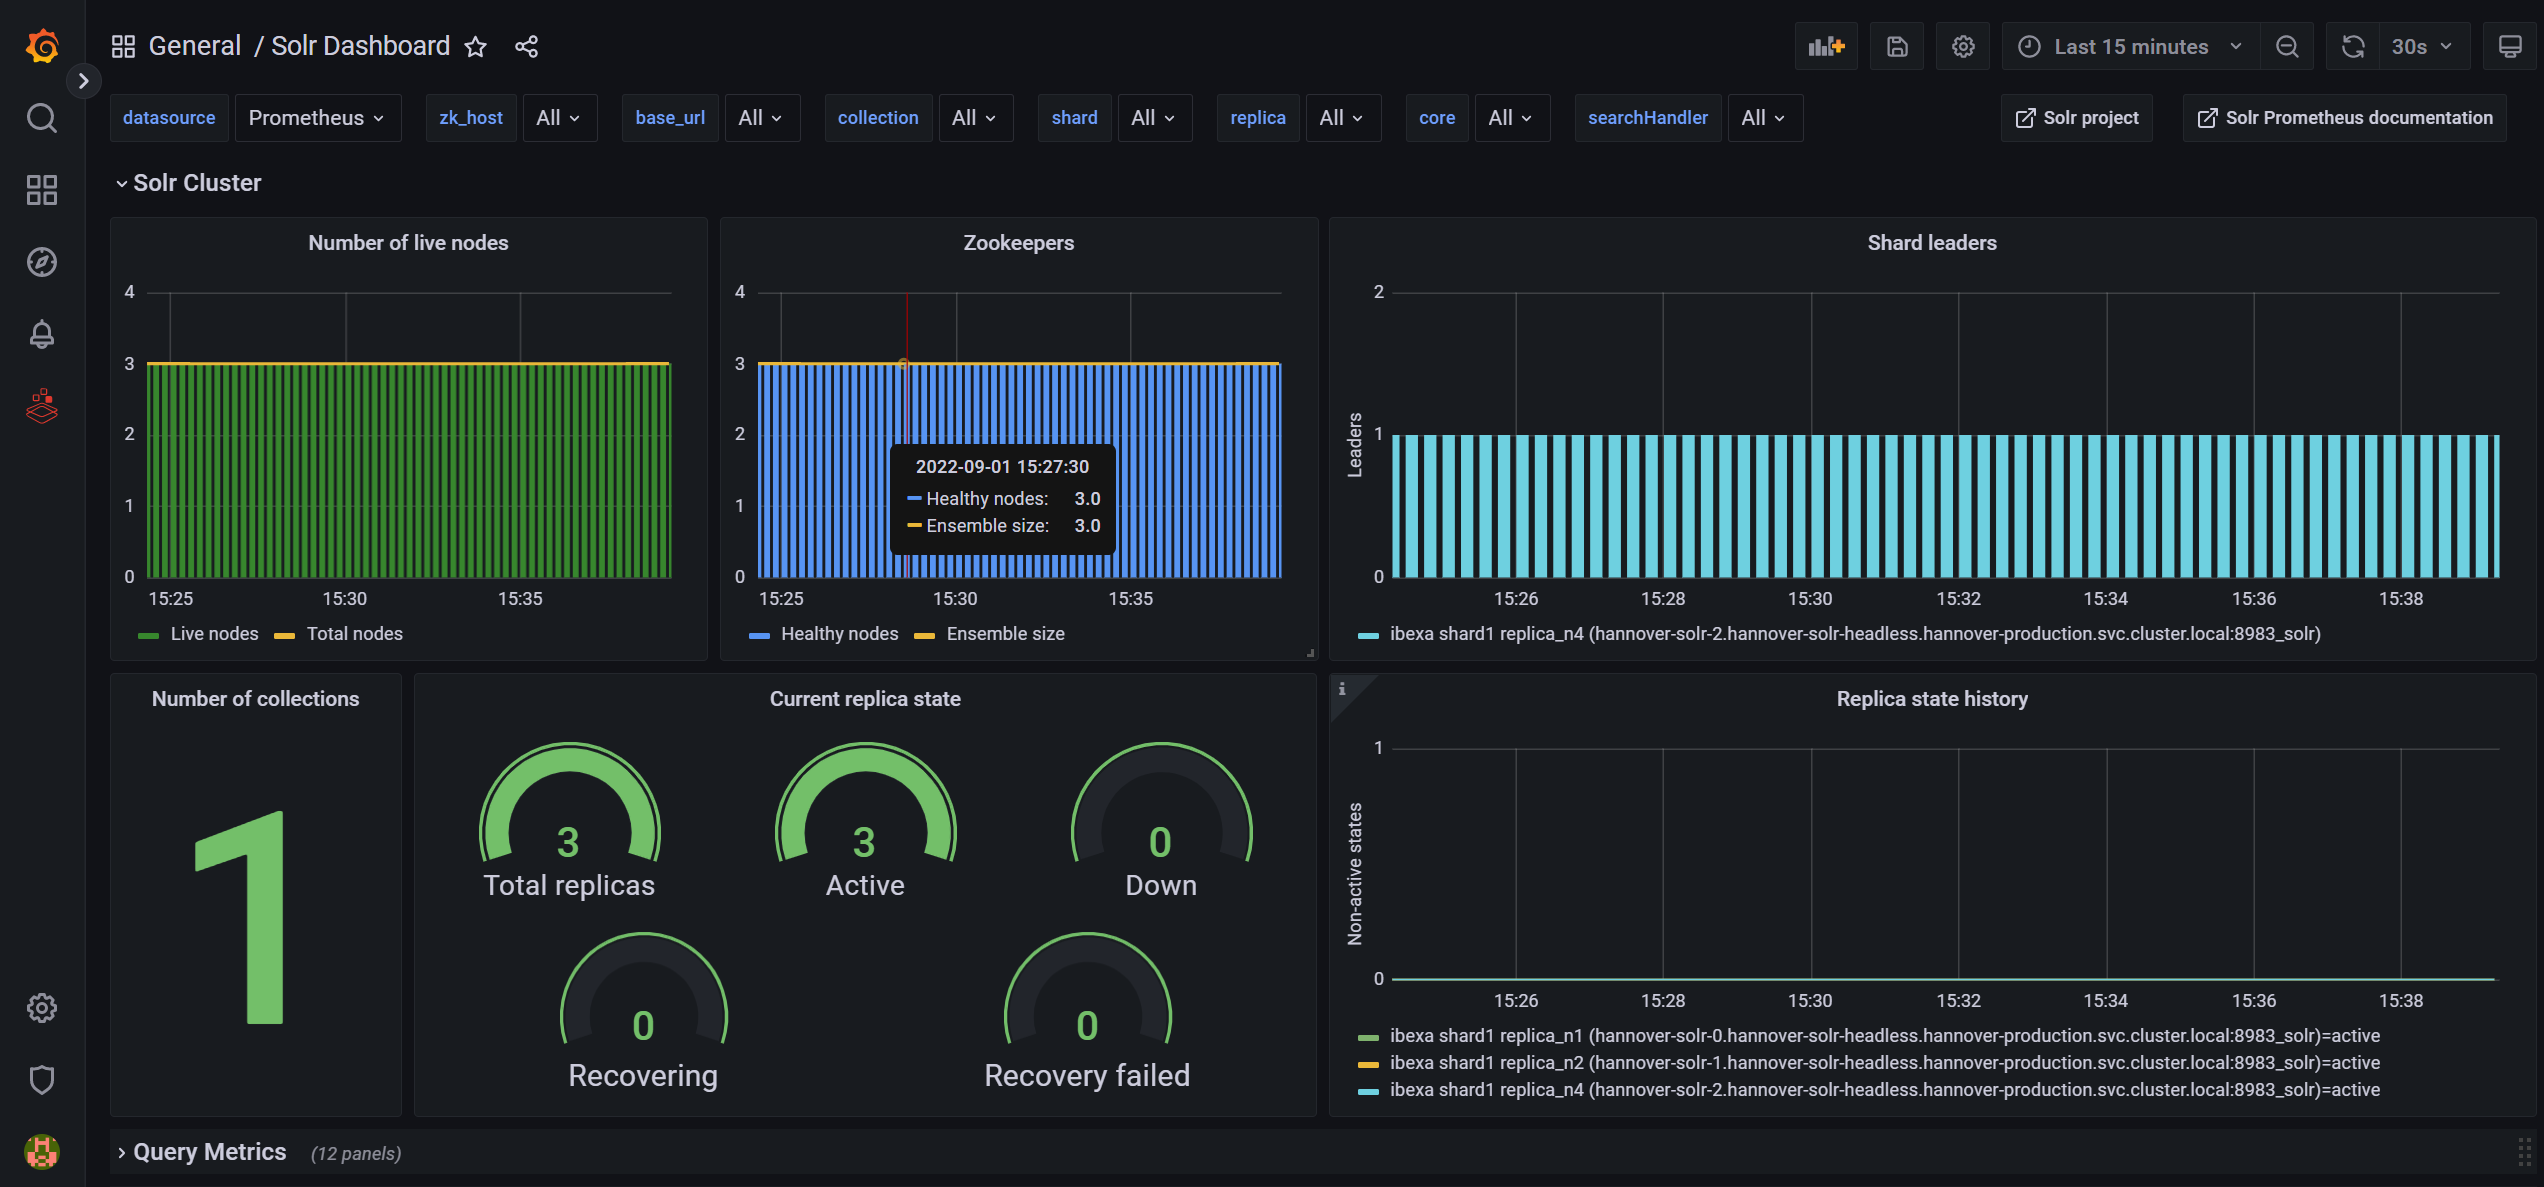
- Solr (Dashboard)
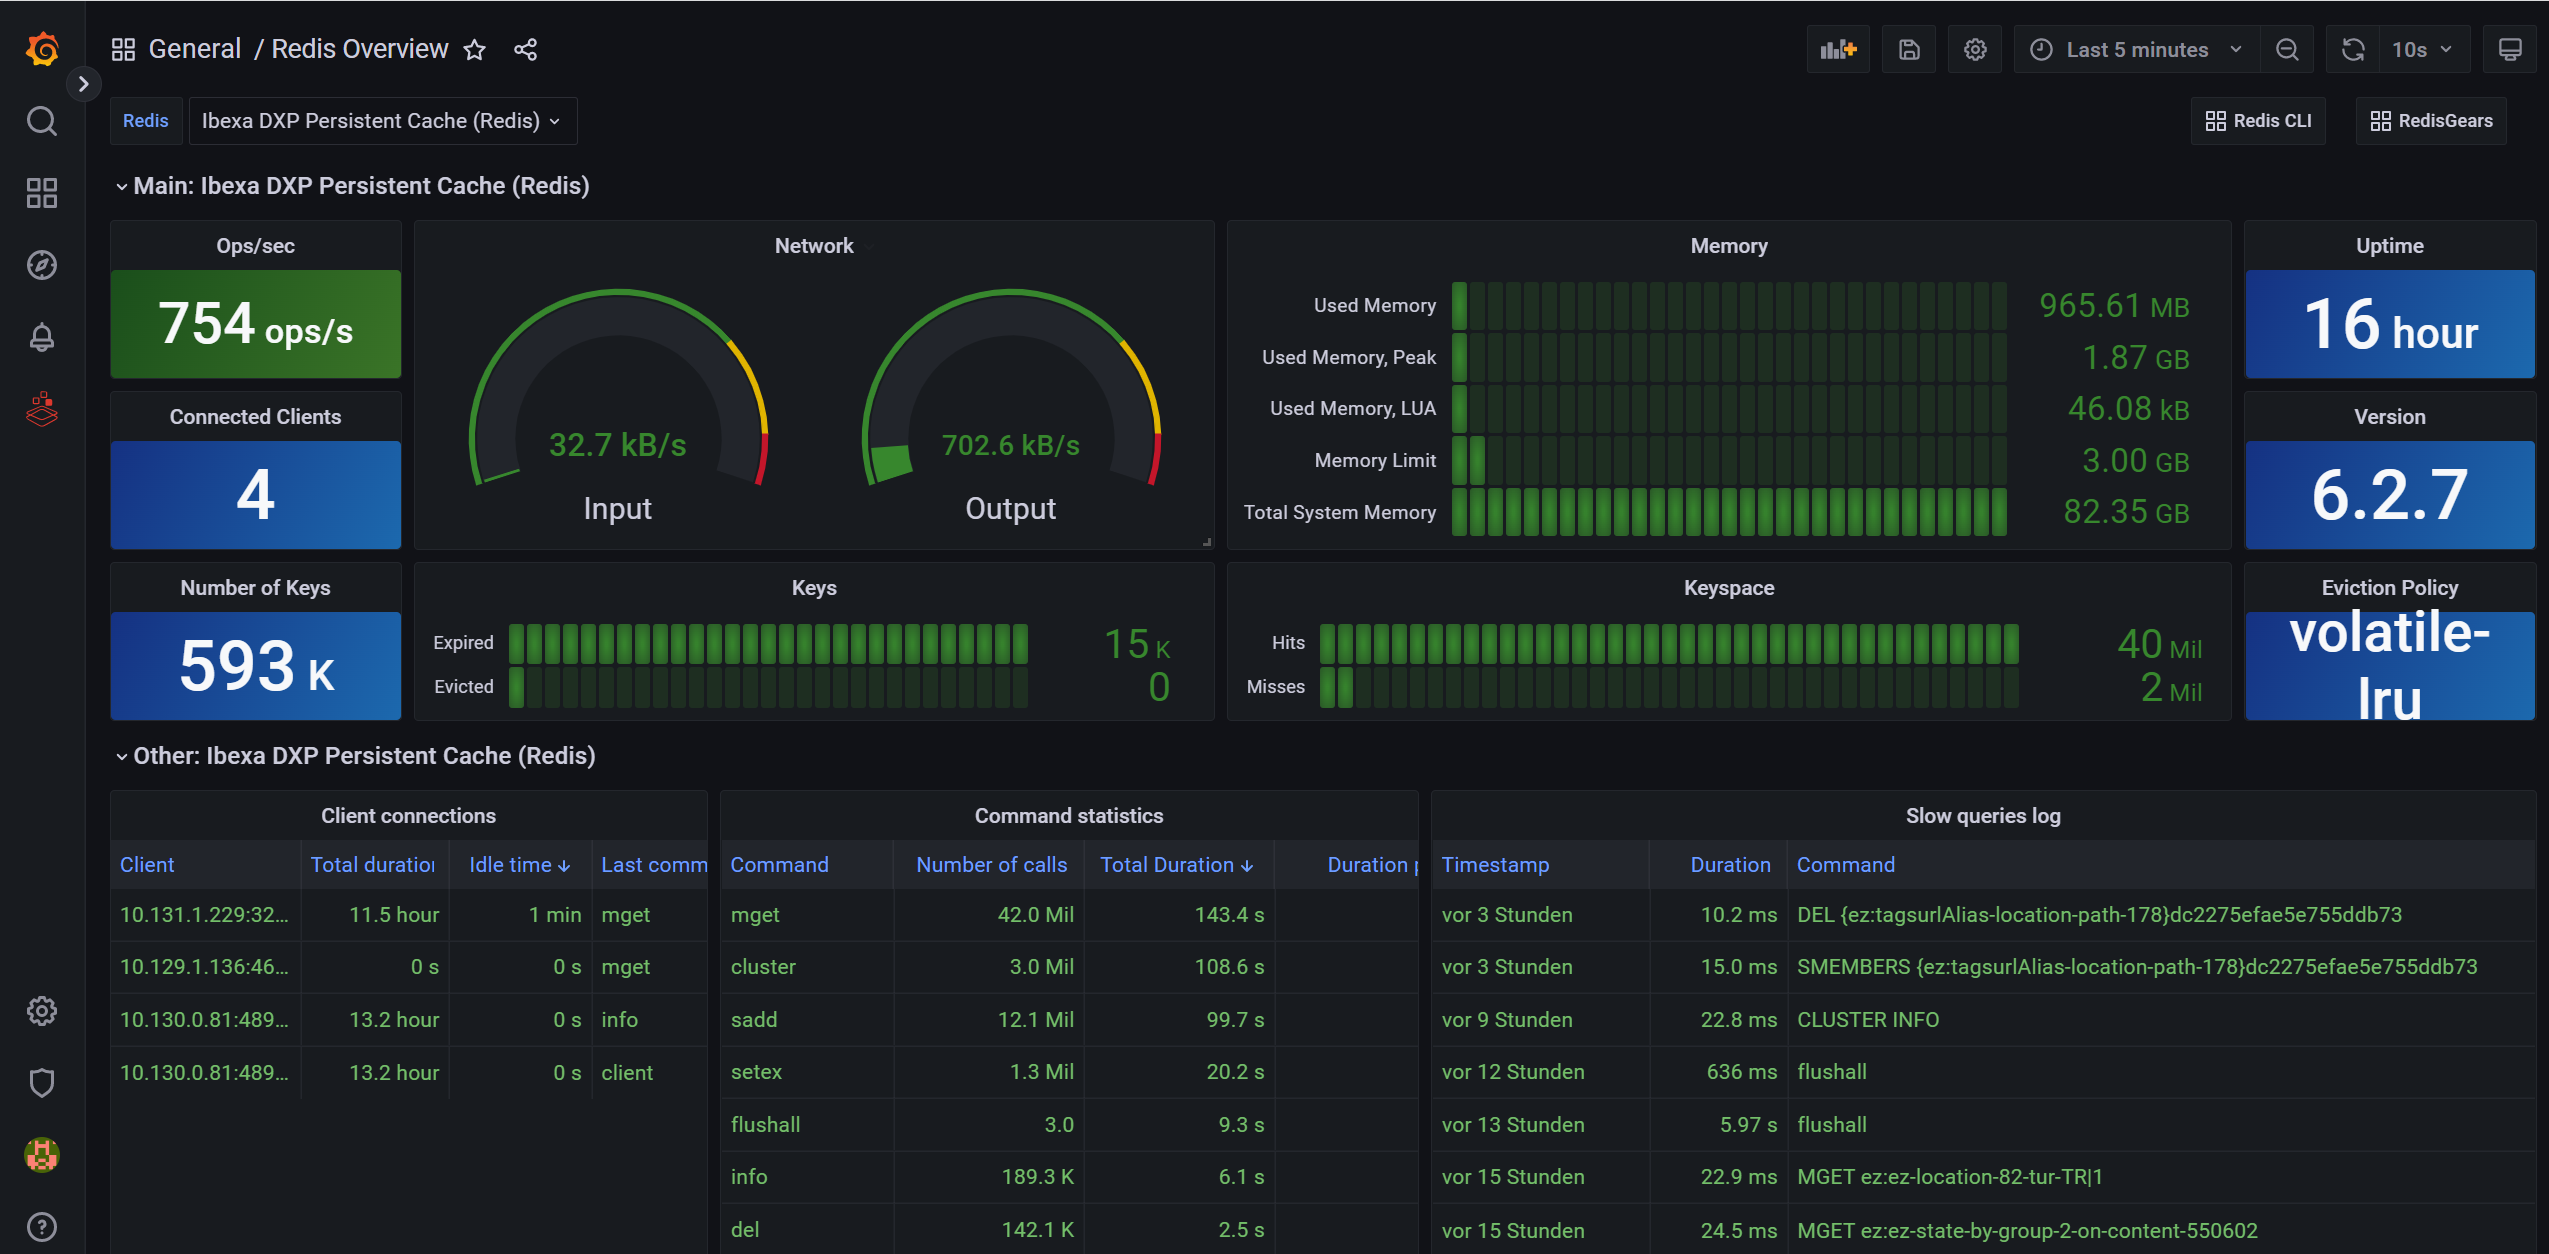
- Redis (App)